Average numbers for National Baseball Hall of Famers: Starting Pitchers
- John Butler
- Feb 7, 2022
- 7 min read

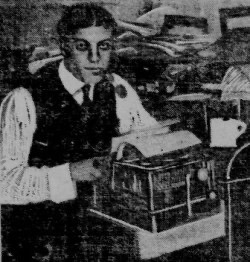
Walter Johnson was inducted to the Hall of Fame’s inaugural
class of 1936 alongside Ty Cobb, Christy Mathewson, Babe
Ruth, and Honus Wagner. Johnson retired with 417 wins and
110 shutouts with the latter being a major league record. Photo
by PD and Baseball Hall of Fame.
Jack Butler
The past month has been spent gathering stats of all 268 Hall of Fame players categorizing them into one of the eleven positions. Each position’s stats from starting pitcher to designated hitter were averaged to determine the benchmarks a player would need to meet to be inducted into Cooperstown. Even though Baseball Reference does the average WAR, WAR 7, WAR 7 Adj, JAWS, S-JAWS, and WAR/162 it doesn’t look at counting stats such as wins, loses, ERA, and ERA+. Also, the popular baseball stat site only accounts Hall of Famers who played in the MLB and leaves out those who competed in the Negro Leagues. These players stats don’t equal those who played in the MLB, but still need to be celebrated and are included in the averages as they have a plaque in Cooperstown.
In the stats collected through Microsoft’s Excel, there are 76 starting pitchers ranging from Walter Johnson, inducted in 1936, to Jim Kaat who will be enshrined in July 2022. The average WAR for a Hall of Fame starting pitcher is 67.3 which is 5.7 less WAR than Baseball Reference. Regarding wins, the average was 245 which by today’s standards is hard for a starter to reach as pitchers aren’t pitching late in games and aren’t racking up 20-win campaigns like the great hurler’s of the 1960s, 70s, 80s, 90s, and early 00s. So, winning 200 games is a fantastic accomplishment for a modern pitcher like Justin Verlander and Zack Greinke, but some of the game’s greatest such as Rube Waddell, Ed Walsh, Sandy Koufax, and Addie Joss never won 200 games. Those four pitchers didn’t exactly need to win 200 games as their careers were extremely short and they all dominated. The losses stand at 166 which was achieved by all of the Negro League hurlers as each of them were below the average number of losses while six of the first eight Hall of Fame starting pitchers had more losses due to pitching more games and innings than any other pitchers.
Moving to win percentage, the average to be in the Hall is .604 and is reached by 35 of the 76 starters with the highest win percentage belonging to Negro Leaguer José Méndez at .769. ERA stands at 3.03 with fifteen of the first seventeen starters inducted having a career ERA below 3.03 with thirteen having an ERA under 3 and Ed Walsh is the lone member with a sub 2 at 1.82. Walsh has the lowest career ERA of all time while those seventeen members average to have a 2.59 ERA. On the other end, the last seventeen inducted had an average ERA of 3.34 with only 3 to have an ERA under 3.03, containing Hilton Smith, Ray Brown, and Pedro Martínez. The average games appeared in is 533 while games started sits at 455. The majority of the pitchers from the Dead Ball Era appeared and started in more than the required games and so did some hurlers whose careers took place in the 1960s, 70s, 80s, 90s, and early 00s. Notable hurlers who are retired to reach these marks are CC Sabathia, Roger Clemens, Curt Schilling, Tommy John, Bartolo Colón, and Dennis Martínez.
*Note: Bold indicates a retired player who has not been inducted into Hall of Fame and Italics indicates a retired player who took steroids and is not in the Hall of Fame.
Games finished is an irrelevant stat for starting pitchers with only nine Hall of Famers with over 100 which is way over the average of 53. Complete games and shutouts are at 249 and 39 respectively with CG’s met by 25 of the first 27 starters inducted while 24 of those 27 hurlers reached the SHO’s. Of the last 27 Hall of Fame starters, 11 met the complete games and 12 reached the amount of SHO’s which is 40.7% and 44.4% respectively. Complete games and shutouts are hard to come by in today’s game by the best pitcher’s and won’t expect them to reach the averages since baseball continues to change.

This graph looks at 25 of the first 27 Hall of Fame starting pitcher’s complete games and shutout numbers from the election years of 1936 to 1967. 17 of these hurlers exceeded both CG and SHO except for Joe McGinnity, Lefty Grove, Carl Hubbell, Herb Pennock, Ted Lyons, John Clarkson, Eppa Rixey, and Red Fabre. Graph by Jack Butler.

This graph examines the last 27 Hall of Fame pitchers from complete games and shutout numbers from the election years of 1991 to 2022. Only 9 of these pitchers have exceeded the averages of both CG and SHO and the last hurler to achieve it was Bert Blyleven who was inducted in 2011. Graph by Jack Butler.
Starters don’t typically have high save numbers unless you are John Smoltz who moved to the closer role for the Atlanta Braves from 2001-2004 after recovering from Tommy John surgery and racked up 154 saves which is the most by a Hall of Fame starter. That is an 805.882% increase from the average of 17 saves.
The next stat of innings pitched average is 3,640 innings that has been reached by 8 – almost half – of the last 18 Hall of Fame pitchers. Of those last 18 players, no pitcher reached both the inning pitch mark and earned runs average of 1223. Of the 7 pitchers to have less career earned runs include Pedro Martínez and Roy Halladay who averaged to toss 2,788.1 frames. Home runs can end up being earned runs and regarding pitchers in the Hall, 27 of the first 33 hurlers enshrined gave up less than 195 career runs for an average of 117. This is due to these pitchers playing in the Dead Ball Era where home runs weren’t prevalent yet but the ones to pitch in the eras that followed allowed more big fly’s as 10 of the last 33 inductees have given up less than the average home runs. Of the 10 starters, only 1 pitcher’s career took place after the Dead Era and that was Hal Newhouser who won back-to-back AL MVPs in 1944-1945.
Walks is an interesting one to examine as there are only a handful of pitchers to reach or exceed the innings requirement and issue 1,004 or less walks which includes Christy Mathewson, Pete Alexander Old Hoss Radbourn, Bud Galvin, Waite Hoyt. Jim, Bunning, and Greg Maddux. Unlike walks, the 2,060 strikeouts have been reached by the last 10 Hall of Fame pitcher for an average of 3,066 punch outs while only half of them tossed more innings than the average. Even more intriguing is two of those other five struck out 3,000 or more batter in less than the required innings are John Smoltz and Pedro Martínez.
ERA+, Fielding Independent Pitching (FIP) and Walks plus his per inning pitched (WHIP) are the last three statistics to be looked at to determine if a pitcher is a Hall of Famer. The average of a 125 ERA+ means the 76 pitchers are a combined 25% better than the average pitcher. Fielding independent pitching (FIP) is a statistic according to Piper Slowinski of Fangraphs that “estimates a pitcher’s run prevention independent of the performance of their defense” (2010). FIP ranges from an excellent 3.20 to an awful 5.00 which is based on 2016 Run Environment (Slowinski, 2010). The Hall of Famers average a 3.11 FIP which is amazing and the highest one belongs to Jack Morris with a 3.94 FIP which is 4 points above his Cooperstown high 3.90 career ERA. WHIP is a stat used to measure how many base runners a pitcher allows per innings pitched and the average is 1.202. Addie Joss holds the record for lowest career WHIP at 0.968 and is the only Hall of Fame pitcher to allow less than 1 baserunner per inning pitched.
Of these three stats, some pitchers are in a league of their own as Walter Johnson, Christy Mathewson, Cy Young, Pete Alexander, Rube Waddell, Ed Walsh, Tim Keefe, Satchel Paige, Sandy Koufax, Addie Joss, Bob Gibson, Tom Seaver, Bill Foster, Bullet Rogan, Hilton Smith, and Pedro Martínez are the only Cooperstown members to reach or exceed the averages of ERA+, FIP, and WHIP. These doesn’t lower the other players in the hall as they were all voted in by meeting the other important criteria of WAR, wins, losses, ERA, W-L%, team success, complete games and shutouts (isn’t relevant for modern pitchers whose career began in the 21st century), innings pitched, and strikeouts. Looking forward to the next pitchers on the ballot such as CC Sabathia in 2025 and whenever Zack Greinke, Justin Verlander, Clayton Kershaw, and Max Scherzer retire is to examine their careers in the era they played in instead of comparing them to pitchers of the past.

Out of the 76 Hall of Fame starting pitchers only 16 pitchers have exceeded the average ERA+, FIP, and WHIP. That’s only 21% of the players enshrined in Cooperstown. Looking at ERA+, the highest belongs to Bill Foster at 164 with Bullet Rogan and Pedro Martínez trailing behind at 161 and 154 respectively. Graph by Jack Butler.
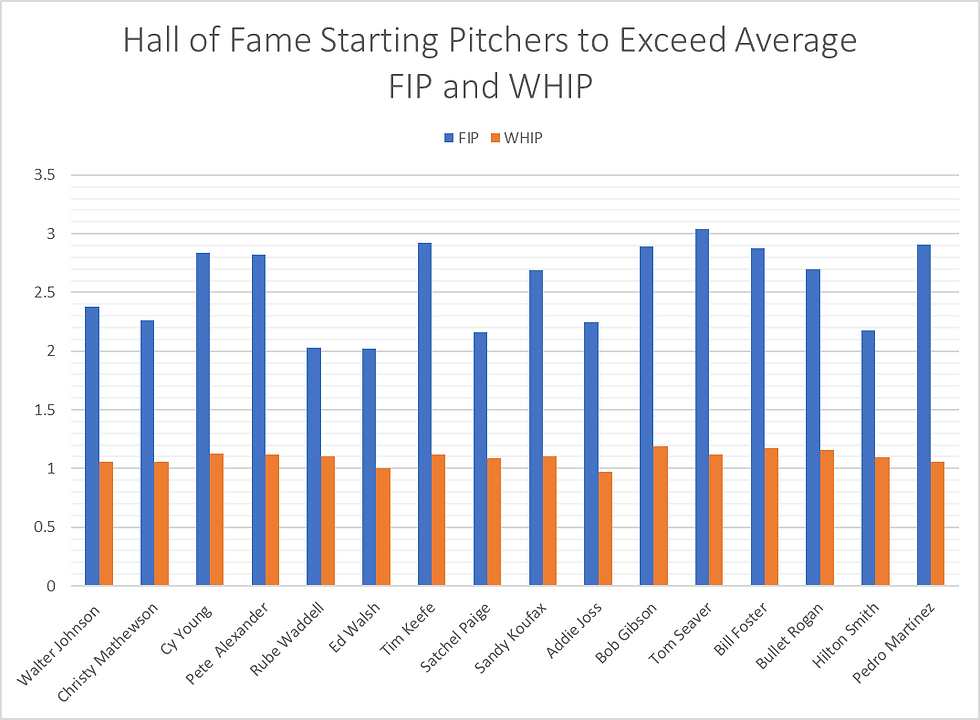
Above are the 16 Hall of Fame starters to exceed the average FIP and WHIP. The lowest WHIP belongs to Addie Joss at 0.968 and Ed Walsh has the greatest FIP of all time at 2.02. Joss and Walsh were two of the most celebrated pitchers of the Dead Ball Era and battled it out on October 2, 1908, in what many historians call the greatest pitcher's duel in baseball history. Graph by Jack Butler.
Sources
Baseball Reference. (2022). Retrieved February 4, 2022, from https://www.baseball-reference.com/
Slowinski, P. (2010, February 15). FIP | Sabermetrics Library. Fangraphs. Retrieved from https://library.fangraphs.com/pitching/fip/


Comments